CHTN Data
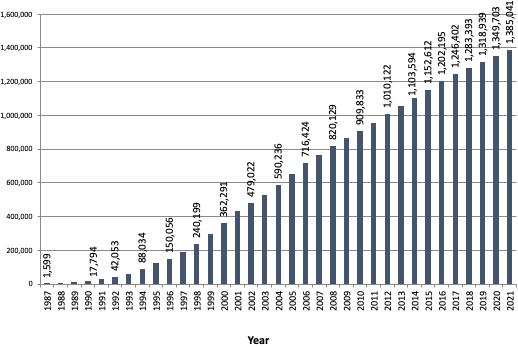
Cumulative Data
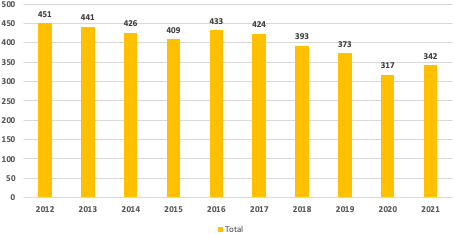
Total # of Investigators Served Per Year (2012 - 2021)
Bar Graph Data
- 451 served in 2012.
- 441 served in 2013.
- 426 served in 2014.
- 409 served in 2015.
- 433 served in 2016.
- 424 served in 2017.
- 393 served in 2018.
- 373 served in 2019.
- 317 served in 2020.
- 342 served in 2021.
Total Samples Distributed by the CHTN
Bar Graph Data
- 1,599 distributed in 1987.
- 17,794 distributed in 1990.
- 42,053 distributed in 1992.
- 88,034 distributed in 1994.
- 150,056 distributed in 1996.
- 240,199 distributed in 1998.
- 362,291 distributed in 2000.
- 479,022 distributed in 2002.
- 590,236 distributed in 2004.
- 716,424 distributed in 2006.
- 820,129 distributed in 2008.
- 909,833 distributed in 2010.
- 1,010,122 distributed in 2012.
- 1,103,594 distributed in 2014.
- 1,152,612 distributed in 2015.
- 1,202,195 distributed in 2016.
- 1,246,402 distributed in 2017.
- 1,283,393 distributed in 2018.
- 1,318,939 distributed in 2019.
- 1,349,703 distributed in 2020.
- 1,385,041 distributed in 2021.
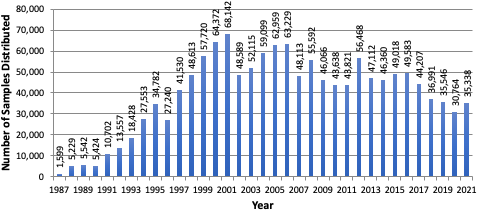
Samples Distributed Per Year (1987 - 2021)
Bar Graph Data
- 1,599 distributed in 1987.
- 5,229 distributed in 1988.
- 5,542 distributed in 1989.
- 5,424 distributed in 1990.
- 10,702 distributed in 1991.
- 13,557 distributed in 1992.
- 18,428 distributed in 1993.
- 27,553 distributed in 1994.
- 34,782 distributed in 1995.
- 27,240 distributed in 1996.
- 41,530 distributed in 1997.
- 48,613 distributed in 1998.
- 57,720 distributed in 1999.
- 64,372 distributed in 2000.
- 68,142 distributed in 2001.
- 48,589 distributed in 2002.
- 52,115 distributed in 2003.
- 59,099 distributed in 2004.
- 62,959 distributed in 2005.
- 63,229 distributed in 2006.
- 48,113 distributed in 2007.
- 55,592 distributed in 2008.
- 46,066 distributed in 2009.
- 43,638 distributed in 2010.
- 43,821 distributed in 2011.
- 56,468 distributed in 2012.
- 47,112 distributed in 2013.
- 46,360 distributed in 2014.
- 49,018 distributed in 2015.
- 49,583 distributed in 2016.
- 44,207 distributed in 2017.
- 36,991 distributed in 2018.
- 35,546 distributed in 2019.
- 30,764 distributed in 2020.
- 35,338 distributed in 2021.
2021 Annual Data
Top 5 Anatomic Sites collected in 2021 |
|---|
Blood |
Kidney |
Lung |
Breast |
Colon |
# of Letters of Support provided in 2021 |
32 |
|---|---|
Total # of Investigators Served |
342 |
# of Samples Distributed |
35,338 |
# of TMA Slides Distributed |
275 |
Digital Images provided |
2,386 |
Top 5 High Impact publications for 2021 |
|---|
Miao Z, Balzer MS, Ma Z, et al. Single cell regulatory landscape of the mouse kidney highlights cellular differentiation programs and disease targets. Nat Commun. 2021;12(1):2277. Published 2021 Apr 15. doi:10.1038/s41467-021-22266-1 |
Frank AC, Ebersberger S, Fink AF, et al. Apoptotic tumor cell-derived microRNA-375 uses CD36 to alter the tumor-associated macrophage phenotype. Nat Commun. 2019;10(1):1135. Published 2019 Mar 8. doi:10.1038/s41467-019-08989-2 |
Saxena V, Gao H, Arregui S, et al. Kidney intercalated cells are phagocytic and acidify internalized uropathogenic Escherichia coli. Nat Commun. 2021;12(1):2405. Published 2021 Apr 23. doi:10.1038/s41467-021-22672-5 |
You D, Hillerman S, Locke G, et al. Enhanced antitumor immunity by a novel small molecule HPK1 inhibitor. J Immunother Cancer. 2021;9(1):e001402. doi:10.1136/jitc-2020-001402 |
Northcott PA, Buchhalter I, Morrissy AS, et al. The whole-genome landscape of medulloblastoma subtypes. Nature. 2017;547(7663):311-317. doi:10.1038/nature22973 |